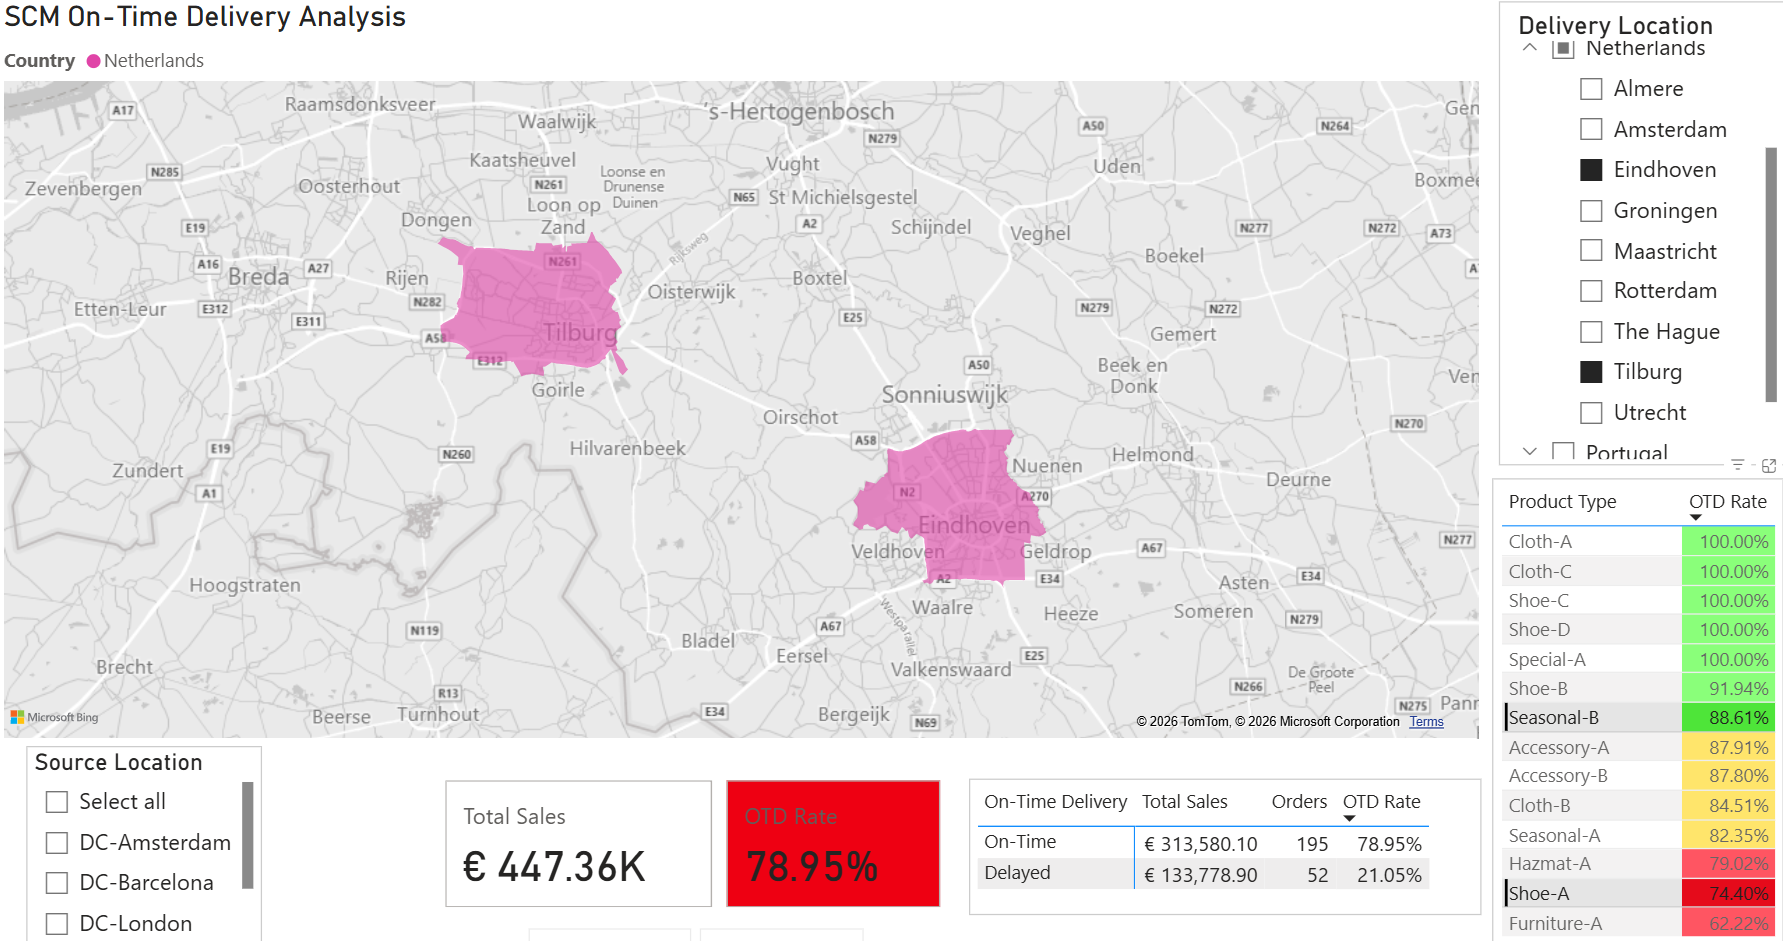
Interactive Supply Chain Management tool created using Power BI
*If numbers display as (Blank) or are nonresponsive: Click anywhere on the map.
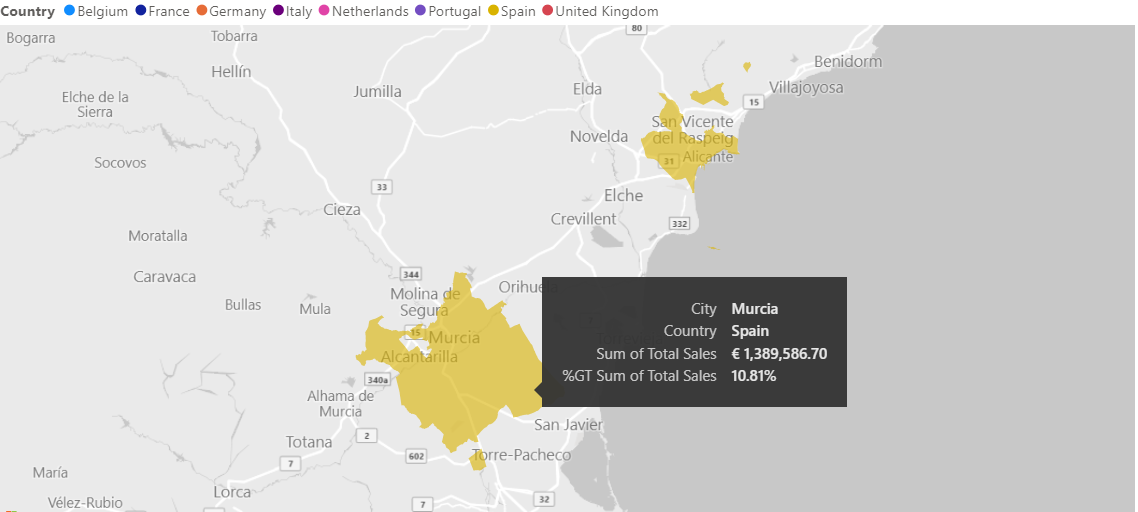
*Use Drill-up feature to display cities on the Map.
Description
The purpose of this visual is to monitor on-time delivery (OTD) metrics to ensure timely fulfillment of customer orders. It can also be used to track delivery lead times, order processing times, and inventory availability to minimize stockouts/backorders.
It can help with gaining insights into each Distribution Center's performance, including inventory levels, order fulfillment rates, product-specific performance, and shipping efficiency. Comparing metrics across different DC’s can help identify bottlenecks and opportunity areas for optimization.
How Can We Use this?
With instantly refreshable data, analysis for potential business optimization becomes swift and efficient.
To improve on-time rates for a specific product with historically poor delivery records, we can target potential solutions based on both the source and delivery locations.
Example:
*The data is not accurate it is only made up for this project.
Any questions? Just reach out and I’m happy to help.